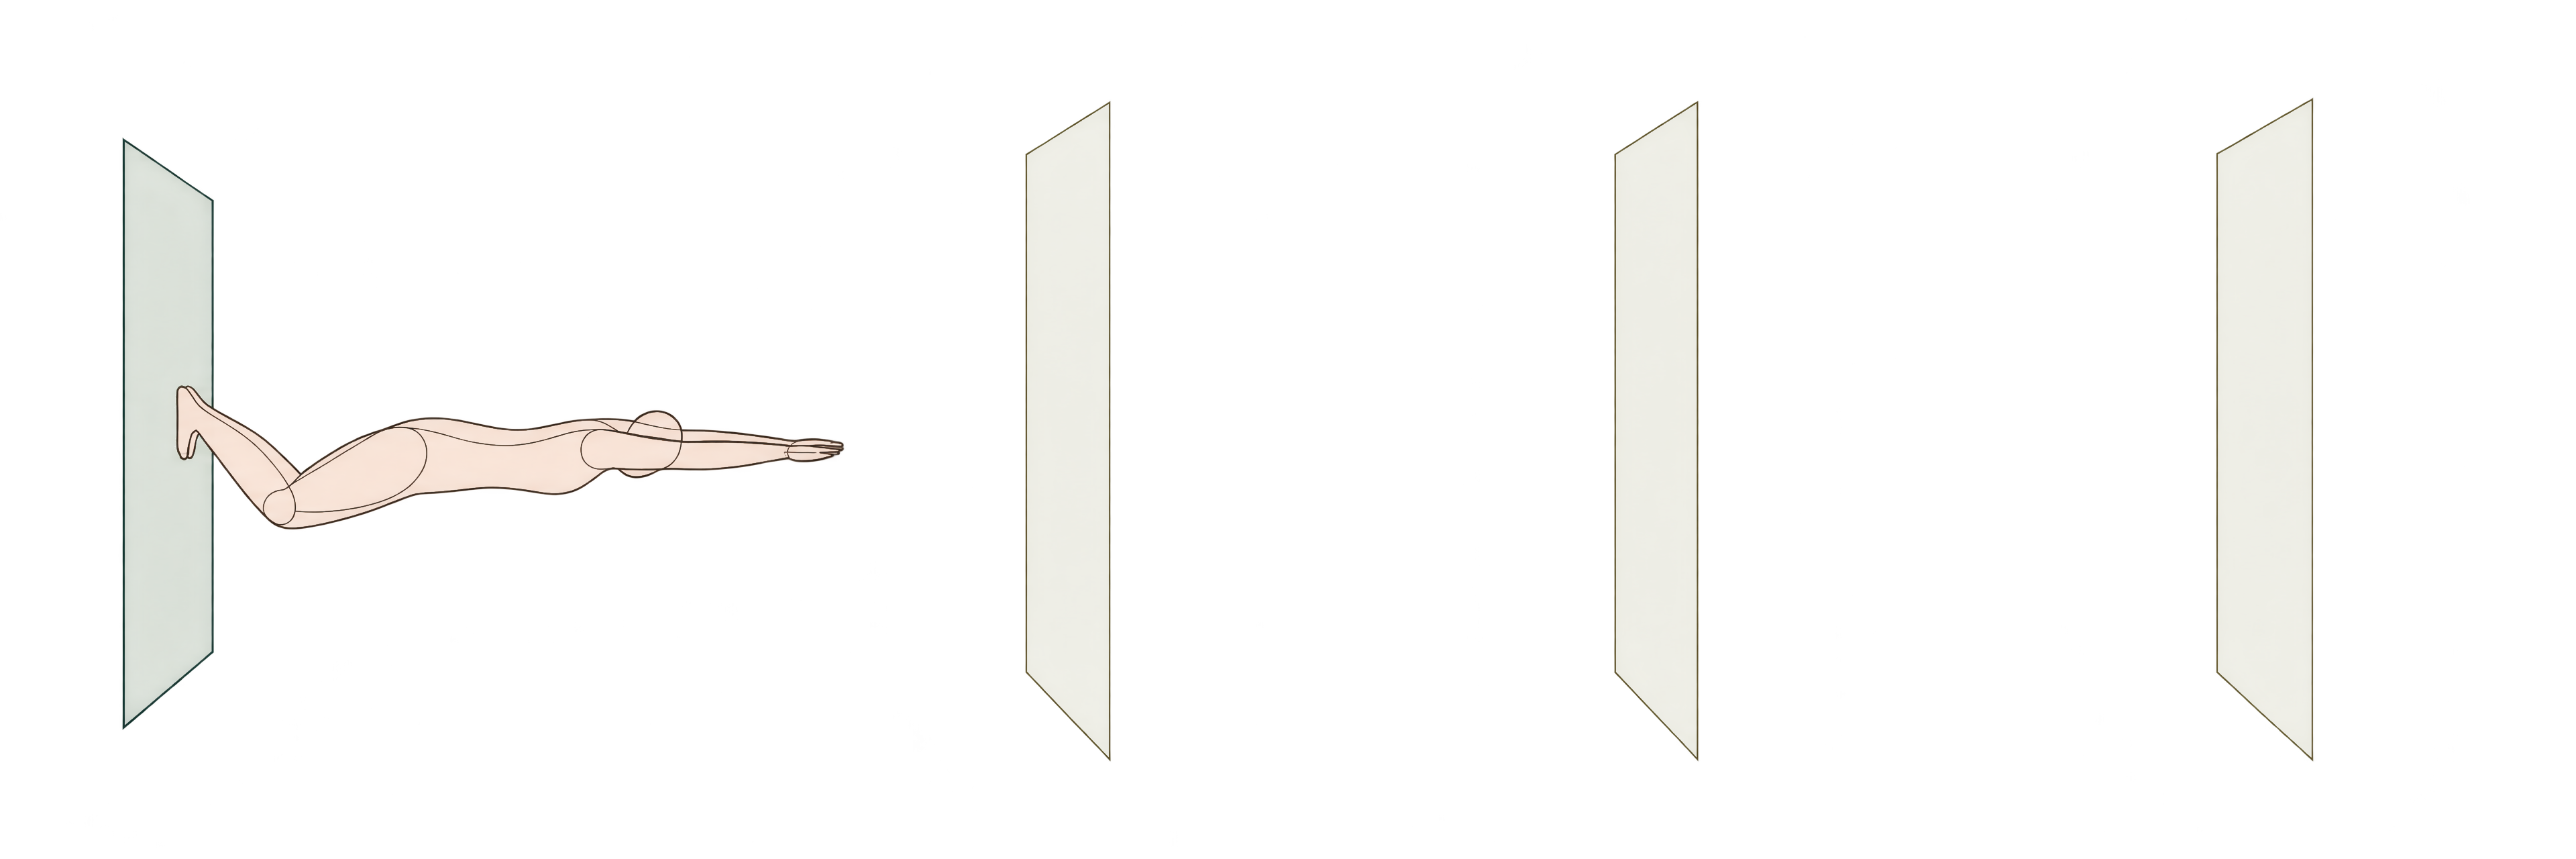
Anyone who has swum the 1000-yard freestyle in winter and the 800-meter freestyle in summer — or survived the back half of a 200 butterfly or 400 individual medley in a 50-meter pool — knows in their lungs that the wall is a different sport.
In a 25-yard pool (SCY), a 1000 freestyle gives you 39 flip turns. Thirty-nine times in ten minutes you get to plant both feet against a solid bulkhead, push off at nearly twice your surface swimming velocity, hold a tight streamline underneath the bow wave where wave drag drops away, and surface as far as fifteen meters down the pool before taking a breath. Move that race to a 50-meter long-course pool (LCM) for the 800 freestyle and 24 of those walls vanish. You get 15 turns across 800 meters of open water. In the 200 butterfly or the breaststroke leg of a 400 IM, the missing walls hit even harder: every extra fifteen meters of uninterrupted surface swimming compounds stroke decay when your hips start to drop.
Yet for decades, competitive swimming has converted times between courses using two simplifying assumptions:
- NCAA Rule 3, Appendix B (
ncaa-2025-27) multiplies your time by a single constant per event and category . Whether you swim a 100-yard freestyle in 43 seconds or 68 seconds, the multiplier is identical. - Colorado Timing / TeamUnify (
colorado-teamunify-2026) scales your time by a constant multiplier and adds a fixed offset per 50 that depends on the stroke , independent of both your pace and whether you are swimming in the men's or women's category.
When I built Turnmark — an offline-first swim converter and standards tool backed by a shared Rust core across WebAssembly, iOS, Android, and MCP — I started with those two published systems because they are the rules on the meet sheet. I swam competitively for over a decade, growing up in Colorado and through school in Fort Collins at 5,000 feet, and spent much of it staring at altitude-adjusted and course-converted seed times on heat sheets. If a championship meet requires NCAA Appendix B or Colorado Timing for entry seed times, a tool has to reproduce that published calculation to the hundredth of a second.
Still, after spending the last decade building confidence-scored knowledge graphs and provenance systems, a single magic constant in a JSON file bothered me. I wanted to know how well those rules actually predict what happens when the same human being steps onto the blocks in a different pool length within the same month. And if they systematically miss, I wanted to know whether I could train a better conversion model and ship it inside the same stateless, zero-network Rust binary.
To answer that, I pulled 6,320,277 usable individual competition swims across 213,105 swimmers and 4,721 meets (2010–2026), matched about nine in ten meets to the building they were swum in, and pressure-tested published and empirical conversion models across every event in the sport. The full technical tables live in the repository's research report. This essay is about what the data showed, how I structured the local data architecture to make 6.3 million rows feel instantaneous in both point lookups and analytical scans, and how a 10-kilobyte spline ended up inside a Rust engine.
#Why a constant multiplier tilts across pace
A constant multiplier makes one quiet assumption about the person behind the time: that a swim is exactly what it says it is. Multiply it, and you have that swimmer in the other pool.
When I isolated 25,855 held-out 30-day same-swimmer transitions (3,223 disjoint test swimmers who never appeared in training or validation), that assumption showed up immediately as a tilt in NCAA's signed prediction error (, so a negative bias means the conversion promised a faster swim than the swimmer delivered):
Across the fastest quartile (Q1), NCAA conversions are biased by −0.55s (predicting times over half a second faster than the swimmer actually swims). Across the slowest quartile (Q4), NCAA conversions flip to +0.59s. A single constant multiplier per event has only one degree of freedom; it can cross zero at a single reference speed, and everywhere else it tilts.
My first explanation was the water. Drag at the surface grows with the square of speed and the power to hold a pace with the cube , and fast swimmers carry more speed off every wall, so losing walls should cost them more. It's a good story. It is mostly not what this tilt is.
The quartiles are assigned by the swim being converted, and any single swim is part ability and part day. A swimmer who lands in the fastest quartile got there partly by having a good one, and their next swim, in either pool, tends to drift back toward their usual. The slowest quartile drifts the other way. That is regression to the mean, and it draws exactly this tilt with no physics at all. The check is a quantile-equivalence model, which maps percentiles between courses and knows nothing about walls: it shows nearly the same tilt (−0.50s and +0.53s). The pace curve, which learns the expected next swim given the entered one, cuts it to −0.24s and −0.05s.
So the tilt says less about walls than about what a conversion is for: predicting a swim you haven't seen from one noisy swim you have. A rulebook multiplier takes your best day at face value. A model fit to real pairs learns to expect a little less from a fast day and a little more from a slow one. Walls still matter, which is why multipliers differ by event and course, but this data can't separate a biomechanical tilt from the statistical one.
#Why the two rulebooks miss in opposite directions
On average, NCAA is almost exactly unbiased (+0.004s across the test set) and tilted across pace. Colorado Timing averages close to zero too (−0.08s), but only because its misses cancel: it converts yards to meters about 2.6 seconds too fast and meters to yards about 2.4 seconds too slow. Its formula multiplies by 1.11 and adds a fixed offset per 50 that depends on the stroke (0.80s for freestyle and IM, 0.60s for backstroke, 0.70s for butterfly, 1.00s for breaststroke), with separate constants for the distance freestyles.
I can't prove who wrote those tables or what they were guarding against, but the shapes fit two different jobs. NCAA's multipliers, which run from about 1.13 to 1.20 going yards to long-course meters depending on the event, are entry-standard math for a championship that has to treat a converted time as a legal fact. Colorado's affine formula is seeding math for club meets, where the cost of a bad conversion is a kid in the wrong heat. That is the lesson I keep relearning when I audit domain rules against raw data: what looks like a single mathematical constant in a PDF is usually a compressed institutional decision. The numbers tell you where it misses; only the people who wrote it can tell you why.
#Data architecture: why one database is the wrong shape for 6.3 million swims
Before I could train a model on longitudinal transitions, I had to solve two data engineering problems that show up whenever you work with real-world sports archives: entity resolution across messy administrative filings, and the storage conflict between athlete-history point queries and analytical self-joins.
#1. Matching meets to buildings
Swimming meet exports (.sd3, .cl2, and .hy3 archives from USA Swimming Local Swimming Committees and YMCA National Championships) record meet names, dates, courses, and raw clock times, along with an optional B1 header containing host city, state, and declared pool altitude. They rarely hand you a clean foreign key to a physical building.
So I joined each meet header to a directory of facilities in two deterministic passes: postal code first, then city and state. About nine in ten meets resolved to a single facility. That join is a proxy, not a survey. Two meets "in the same building" means both headers resolved to the same facility in the same ZIP code; it can't tell a competition pool from the warm-up tank next door, and it can't see a bulkhead move.
#2. The dual-store local lakehouse (SQLite + Iceberg/Parquet)
Once I consolidated 6,320,277 usable distinct finishes (6,325,452 raw rows from 11 collections covering 13 regional and national archives: North Carolina, Pacific, Southeastern, Michigan, Adirondack, Potomac Valley, South Dakota, Midwestern, Kentucky, Montana, YMCA Nationals, Utah, and South Texas), I had to decide where to put them.
Why those 13? Mostly availability: they publish bulk Hy-Tek Meet Manager exports (.zip bundles of .sd3, .cl2, and .hy3 flat files) that I could collect. It is a collection milestone, not a balanced national sample. Only Adirondack and Potomac Valley reach back to 2010; most archives start between 2013 and 2021, and YMCA Nationals, Kentucky, and South Texas cover only 2025–2026.
The dataset has to answer two opposite access patterns:
- Point lookups (OLTP-shaped): "Give me every race swum by athlete
(source, swimmer_id)in chronological order." An interactive history inspector or data-hygiene audit needs sub-millisecond random access by athlete or meet key. - Longitudinal pairing scans (OLAP-shaped): "Self-join 6.32 million rows across
(source, swimmer_id, canonical_event)wherecourse_a != course_band|date_b - date_a| <= 30 days, grouped by event, direction, and venue cohort."
Put 6.32 million rows in a single indexed SQLite database and point lookups fly, but full-table analytical self-joins drag through gigabytes of row-oriented B-tree pages. Put them in Parquet files and analytical scans fly, but looking up a single swimmer's career requires scanning row groups across dozens of files. Separating the two lets each file format do the one job it was designed for.
Now, you could reasonably argue that a lakehouse for 6.3 million rows is overkill, and on size alone you'd be right. Postgres holds this on a laptop: two composite indexes and an afternoon.
But size isn't what makes this data a lake. Shape is. A swim meet is write-once history. Once it ends, its results don't change, except when a correction arrives, and a correction should land as a new version rather than an edit that erases the old one. The research wants the whole archive at once; the app wants one swimmer at a time. That is the shape a lakehouse is built for, and it buys four things a single database would make me engineer by hand:
- Pinned snapshots make the research reproducible. Every result in this essay was computed from one committed Iceberg snapshot,
national-checkpoint-15, and the evaluation receipt records it. The research view reads that snapshot's exact metadata, and a test appends a new snapshot to prove the frozen view doesn't move. When the next archive lands, today's numbers still point at the same bits. - Corrections become versions, not overwrites. A changed result gets a new source version and a new table snapshot, with enough provenance to explain why. The pipeline never settles a conflict by quietly keeping the faster time.
- One source of truth; everything else is rebuildable. The original ZIPs stay cached for reparsing, Parquet holds the history, and the SQLite store is a projection that can be thrown away and rebuilt from the snapshot.
- Storage and compute come apart. The files sit on disk at 43 bytes a row and cost nothing while idle (cost model, design notes). DuckDB reads them today; any engine that speaks Iceberg can read them later, with no database server to keep running.
And, honestly, scaling Postgres wouldn't have been any fun.
So research/conversion-model/lakehouse.py materializes a dual-store local lakehouse from the canonical ingest store, and a separate probe command checks that the two stores agree:
| Projection | Layout | Size | Per row | Median, first / repeat |
|---|---|---|---|---|
Hot point store (hot.sqlite3) | SQLite B-tree indexed by athlete and date | 5.13 GB | 811 B | 0.173 / 0.011 ms lookup |
Analytical warehouse (warehouse/races/) | Parquet partitioned by year and course, read through DuckDB | 272.8 MB | 43 B | 3.94 / 2.32 ms scan |
The warehouse is 18.8× smaller per row. Latencies are local, measured at national-checkpoint-15; "first" is the first query in an already-running process, not a cold disk.
Every swimmer registration ID is replaced at collection time with a keyed HMAC-SHA256 digest, and the key, the raw exports, and the whole lakehouse stay gitignored on local storage. Only aggregate evaluation receipts and the 10-kilobyte fitted spline table are committed to the repository.
#Training and pressure-testing the models
From the 6,320,277 total races in the lakehouse, 4,374,133 are clean best-of-meet individual finishes in the 14 canonical NCAA-convertible events. Pairing same-swimmer performances across different courses within 30 days yields 177,010 directional transition pairs from 21,970 swimmers. To catch touch-pad and data-entry errors, I dropped 704 of them (0.4%) that were more than 18% off the NCAA conversion or had a long-course swim faster than its short-course pair, leaving 176,306 clean pairs. Because that filter is defined against NCAA, I also scored the untrimmed test set: the pace curve still wins, 2.75s to 3.03s. Widening the window to 60 days yields 406,726 directional pairs.
Every one of those pairs comes from a swimmer who raced both courses within a month, which skews toward committed swimmers in steady training. The results say less about a kid racing long course for the first time in July, whose second swim is as much about learning the pool as converting a time.
To prevent any athlete's personal turn skill from leaking between training and evaluation, I partitioned swimmers deterministically by SHA-256(swimmer_key) into 70% train (123,250 clean 30d pairs, 15,425 swimmers), 15% validation (27,201 pairs, 3,310 swimmers), and 15% test (25,855 pairs, 3,223 swimmers).
#Adaptive 60-day supplementation for distance and specialty events
Sprints (50 Free, 100 Free, 100 Back, 100 Breast, 100 Fly) generate tens of thousands of 30-day pairs naturally because nearly every invitational offers them. The distance freestyles (500/400, 1000/800, and 1650/1500 Free), 200 Back, 200 Breast, 200 Butterfly, and 400 IM are swum less often within a single 30-day cycle.
Rather than starving those events of training data or polluting the 30-day test benchmark, I augmented only the training swimmer partition with 30,572 non-overlapping 31–60 day transitions in those sparse cohorts. Every training pair is weighted by an exponential time-decay kernel , so the longer gaps count for less. The validation and test partitions remain strictly un-augmented.
#The model ladder
I evaluated five candidate models against NCAA (ncaa-2025-27) and Colorado Timing (colorado-teamunify-2026): a quantile-equivalence baseline, which maps a swim's percentile in one course to the same percentile in the other, and four fitted models in two tiers.
In plain terms, each fitted model keeps the NCAA multiplier and learns a correction to it: how much to adjust a conversion depending on how fast or slow the entered swim is for its event. Two guardrails keep that correction honest. It can only bend gently, so a faster swim converts to a faster time, give or take a hundredth of rounding. And a cell with few swims borrows strength from the rest of its event instead of trusting its own noise. The boosted models exist only to check whether anything left over rewards a more flexible shape.
- Tier 1 — Core Input Parity (
swim,to,tableonly):tier1_huber_pace_core(turnmark-empirical-2026): Fits a quadratic residual curve in standardized source time , where and are the cell's median time and scale, on top of the NCAA base multiplier for each of the 154(direction, event, category)cells. It uses Iteratively Reweighted Least Squares (IRLS) with Huber loss, whose threshold is the larger of 0.30s or 2% of the cell's median time, plus a small ridge penalty:Here is the cell's NCAA multiplier, and both and work to the hundredth of a second.
To keep sparse cells from overfitting, every coefficient is shrunk by empirical Bayes : the intercept toward the pooled
(direction, event)median residual, the slopes toward zero. The slopes are also bounded so the curve rises everywhere with the entered time: a faster swim never converts to a slower time before rounding. After rounding the offset and truncating the result, two swims a hundredth apart can occasionally swap order by a hundredth.tier1_gbm_core: A small hand-written gradient booster (depth-3 trees with Huber-clipped gradients) fit on top of the Huber curve's predictions, as a check on what the quadratic misses.
- Tier 2 — Age-Aware Extensions (
swim,to,table,age_years):tier2_huber_pace_age&tier2_gbm_age: Add a standardized age term (clipped to 8–22), a hinge for swimmers under 13, and a flag for a missing age.
#What the holdout numbers show
On the 25,855 held-out 30-day transitions (3,223 disjoint swimmers), here is how the hierarchy stacks up:
| Model | MAE | Median AE | P90 AE | MAE vs. NCAA (95% CI) |
|---|---|---|---|---|
Colorado Timing (colorado-2026) | 3.533s | 2.19s | 7.96s | +0.597s (+20.3%) |
NCAA (ncaa-2025-27) | 2.936s | 1.76s | 6.77s | baseline |
| Quantile equivalence | 2.720s | 1.64s | 6.25s | −0.216s (−7.4%) [−0.258, −0.170] |
Tier 1 Huber pace curve (turnmark-empirical-2026) | 2.666s | 1.61s | 6.17s | −0.270s (−9.2%) [−0.302, −0.234] |
| Tier 1 residual GBM | 2.665s | 1.60s | 6.18s | −0.271s (−9.2%) [−0.303, −0.235] |
| Tier 2 Huber pace + age | 2.627s | 1.56s | 6.04s | −0.309s (−10.5%) [−0.341, −0.272] |
| Tier 2 residual GBM + age | 2.625s | 1.57s | 6.03s | −0.311s (−10.6%) [−0.343, −0.274] |
Intervals are clustered by swimmer. As a share of race time, the average miss is 2.9% for NCAA, 3.3% for Colorado, and 2.6% for the pace curve. RMSE, swimmer-equal and macro-cohort MAE are in the report.
Look closely at the fourth and fifth rows. The booster starts from the quadratic Huber curve and fits trees to whatever it left behind, and it improves the curve by one one-thousandth of a second (2.6658s to 2.6648s MAE).
Once you condition on (direction, event, category), there is almost nothing left for trees to find. That isn't proof that no richer model exists, but it was enough for me: I didn't need to ship decision-tree traversal or ONNX weights into WebAssembly and mobile binaries. Three numbers per cell plus a reference time and scale give a smooth curve that rises with the entered time.
#Where the wall hurts
If you only look at pooled overall MAE (2.94s → 2.67s), sprints dominate the sample count: 50 Free and 100 Free make up about 38% of the test pairs. When you break the holdout set apart by event, Turnmark Empirical beats both NCAA and Colorado on all 14 out of 14 canonical events and all 6 out of 6 course directions.
And on my personal favorite events — the distance freestyles (1650/1500, 1000/800, 500/400), the 200 Butterfly, and the 400 IM — the gains are largest in seconds: 0.6 to 3.3 seconds over NCAA at 30 days, and up to nearly 20 seconds over Colorado.
| Event | Window | Test pairs | NCAA | Colorado | Empirical | vs. NCAA | vs. Colorado |
|---|---|---|---|---|---|---|---|
| 1650y ↔ 1500m Free | 30d | 38 | 31.20s | 47.61s | 27.88s | −10.6% | −41.4% |
| 1650y ↔ 1500m Free | 60d | 120 | 27.84s | 39.22s | 27.78s | −0.2% | −29.2% |
| 1000y ↔ 800m Free | 30d | 134 | 16.04s | 17.59s | 14.16s | −11.7% | −19.5% |
| 1000y ↔ 800m Free | 60d | 350 | 16.66s | 19.73s | 14.83s | −11.0% | −24.8% |
| 500y ↔ 400m Free | 30d | 958 | 7.06s | 10.11s | 6.24s | −11.6% | −38.3% |
| 500y ↔ 400m Free | 60d | 2,293 | 8.68s | 11.37s | 7.45s | −14.1% | −34.4% |
| 200 Butterfly | 30d | 488 | 4.61s | 5.59s | 3.98s | −13.7% | −28.8% |
| 200 Butterfly | 60d | 1,059 | 5.64s | 6.80s | 4.48s | −20.6% | −34.2% |
| 400 IM | 30d | 398 | 6.90s | 9.62s | 6.07s | −12.0% | −36.9% |
| 400 IM | 60d | 952 | 8.41s | 11.17s | 7.01s | −16.6% | −37.2% |
| 200 Breaststroke | 30d | 824 | 4.94s | 6.25s | 3.90s | −21.0% | −37.6% |
Mean absolute error on held-out pairs. Tier 2 age results and median errors are in the report.
Seconds flatter the long events, though. As a share of race time, the picture flips:
| Event (30-day holdout) | NCAA | Colorado | Pace curve |
|---|---|---|---|
| 50 Free | 3.00% | 2.78% | 2.74% |
| 100 Back | 3.21% | 4.20% | 2.77% |
| 200 Breast | 3.01% | 3.83% | 2.37% |
| 200 Fly | 3.21% | 3.91% | 2.77% |
| 500/400 Free | 2.19% | 3.11% | 1.92% |
| 400 IM | 2.27% | 3.19% | 1.98% |
The sprints and the 200s of butterfly and breaststroke miss by the largest fraction, while the 500 and the 400 IM convert best. Colorado actually beats NCAA on the 50 Free, and the pace curve edges it there by four hundredths of a point. The biggest relative gain is the 200 Breast. The seconds table shows where a swimmer feels the miss; this one shows where the rule is most wrong.
The one near-tie is the 60-day 1650/1500, where Turnmark Empirical only matches NCAA (−0.06s), and the 30-day 1650/1500 test set is just 38 pairs, so read that row loosely.
In the 200 Breaststroke (−21.0% vs. NCAA) and 200 Butterfly (−13.7% at 30 days, −20.6% at 60), the wall is also a rest. Both strokes recover both arms at once against the water, and every turn buys a glide or pullout where the shoulders stop working. A 200 has seven turns in a 25-yard pool and three in a 50-meter pool, so each long-course length is more than twice as many strokes without a break. That is a plausible reason those events convert worst under a single multiplier or a fixed per-50 offset; this data shows the size of the miss, not the physiology behind it.
#Isolating the building from the human
Even after fitting a nonlinear pace spline (2.67s overall MAE) and adding age terms (2.63s), why does a residual error of roughly 2.6% of race time remain?
Because most meets resolved to a facility, I could split the test pairs by whether both swims happened in the same building, a rough natural experiment that separates facility and travel variance from the course change itself:
- Same-facility transitions (n = 5,925 test pairs across 946 swimmers): When the same swimmer races two different courses within 30 days and both meets resolve to the same facility in the same ZIP code, the water, blocks, and travel are about as constant as this data can make them. Here,
turnmark-empirical-2026drops to 2.19s MAE (1.36s Median AE, +0.025s bias) compared to 2.53s for NCAA (−13.3%) and 3.32s for Colorado (−34.0%). - Cross-facility transitions (n = 17,836 test pairs across 2,472 swimmers): When the two meets take place in different buildings, MAE rises to 2.83s (1.71s Median AE) for
turnmark-empirical-2026vs. 3.08s for NCAA. That is 0.63s more MAE (0.35s median) than the same-building pairs. These are different swimmers and event mixes, so it isn't a clean measurement of what travel costs, but it points the same way. - Meets at altitude (any Utah or Montana meet, plus meets in Reno/Tahoe and Black Hills ZIP codes or with a declared altitude of 3,000 ft or more; most of these pairs are Reno/Tahoe and the Black Hills): Across 1,287 held-out altitude transitions (166 test swimmers),
turnmark-empirical-2026cuts MAE to 3.67s (2.15s Median AE, and 3.60s with Tier 2 Age) vs. 3.91s for NCAA (−6.2% / −7.9%) and 4.57s for Colorado (−19.8%). - Split-conformal prediction intervals: Using the validation partition, I calibrated distribution-free split-conformal intervals on normalized absolute residuals. On the disjoint test set, the 50%, 80%, and 90% nominal intervals achieve 50.4%, 79.1%, and 89.6% empirical coverage, with median 50% half-widths of ±0.63s on 50 Free, ±1.33s on 100 Free, ±2.94s on 200 Fly, ±4.23s on 400 IM, ±5.45s on 500/400 Free, and ±9.33s on 1000/800 Free.
That ~1.36s median miss inside the same building is mostly the human: taper state, morning prelims versus evening finals, drafting a lane neighbor, or mistiming a finish touch. A course conversion is a point estimate of the center of that distribution — never a substitute for swimming the race.
#Shipping the model inside a stateless Rust engine
A research model that stays in a Python notebook doesn't help a swimmer checking splits on deck with no cell reception. At the same time, Turnmark has a strict architectural rule: crates/turnmark-core is stateless, deterministic, and completely offline. There is no backend inference server, no network call, and no duplicated calculation logic across JavaScript, Swift, and Kotlin.
Because the trees found almost nothing beyond the curve, I exported all 154 fitted (direction, event, category) cells, plus 8 pooled fallbacks for direction-event pairs without a cell, into data/empirical.json (10 KB) and embedded it at compile time into crates/turnmark-core/src/engine.rs. Each cell is five numbers: reference time, scale, and the three coefficients.
fn empirical_offset(
    event: &SwimEvent,
    distance: u32,
    to: Course,
    table: Category,
    seconds: f64,
) -> f64 {
    let dir_event = format!(
        "{}->{}|{distance}-{}",
        course_key(event.course),
        course_key(to),
        stroke_key(event.stroke)
    );
    let cell_key = format!("{dir_event}|{}", category_key(table));
    if let Some(arr) = EMPIRICAL["cells"].get(&cell_key).and_then(Value::as_array) {
        if let [Some(ref_s), Some(scale_s), Some(b0), Some(b1), Some(b2)] =
            [arr.first(), arr.get(1), arr.get(2), arr.get(3), arr.get(4)]
                .map(|v| v.and_then(Value::as_f64))
        {
            let z = ((seconds - ref_s) / scale_s.max(0.01)).clamp(-3.0, 3.0);
            return b0 + b1 * z + b2 * z * z;
        }
    }
    EMPIRICAL["fallbackOffsetSeconds"]
        .get(&dir_event)
        .and_then(Value::as_f64)
        .unwrap_or(0.0)
}
From that single Rust function:
- WebAssembly (
@turnmark/sdk): Compilesturnmark-coreto Wasm (8,701 cross-runtime conformance cases verified identical between native Rust, Node Wasm, and Chromium Wasm), powering the web app, the embeddable widget, and the network-free Cloudflare MCP Worker card. - Native iOS (SwiftUI) & Android (Jetpack Compose): UniFFI generates typed
ConversionMethod.empirical/ConversionMethod.EMPIRICALbindings directly from the Rust enum, exposing Turnmark Empirical alongside NCAA (default) and Colorado Timing under Calculation options and in the method comparison. - Rulebook honesty — and the builder's compromise: NCAA (
ncaa-2025-27) remains the default because meet entry rules are legal contracts, not regression problems. Even when you switch to Turnmark Empirical, I still had to make the same uncomfortable compromise every instrument builder makes: after 6.32 million swims showed that a conversion is a curve with a second or two of human spread around it, the big hero clock on screen still truncates to a single hundredth of a second. You cannot step up onto the starting block chasing a probability band. So the primary display gives you one clean number to race against, and the method spectrum underneath shows you the curve, the turns you gained or lost, and the gap between what the rulebook says and what the water actually takes.
If you have a time from one pool and a meet in another, try it on Turnmark. Enter the swim, pick Turnmark Empirical under Calculation options, then open "How this is calculated": it lays NCAA, Colorado, and the pace curve side by side for that swim, with the spread between them and the walls you gain or lose.
If you swim, coach, or run meets and think I've read the wall wrong, I'd like to hear it: the data, the model, the code, or the argument. Send me a note.


