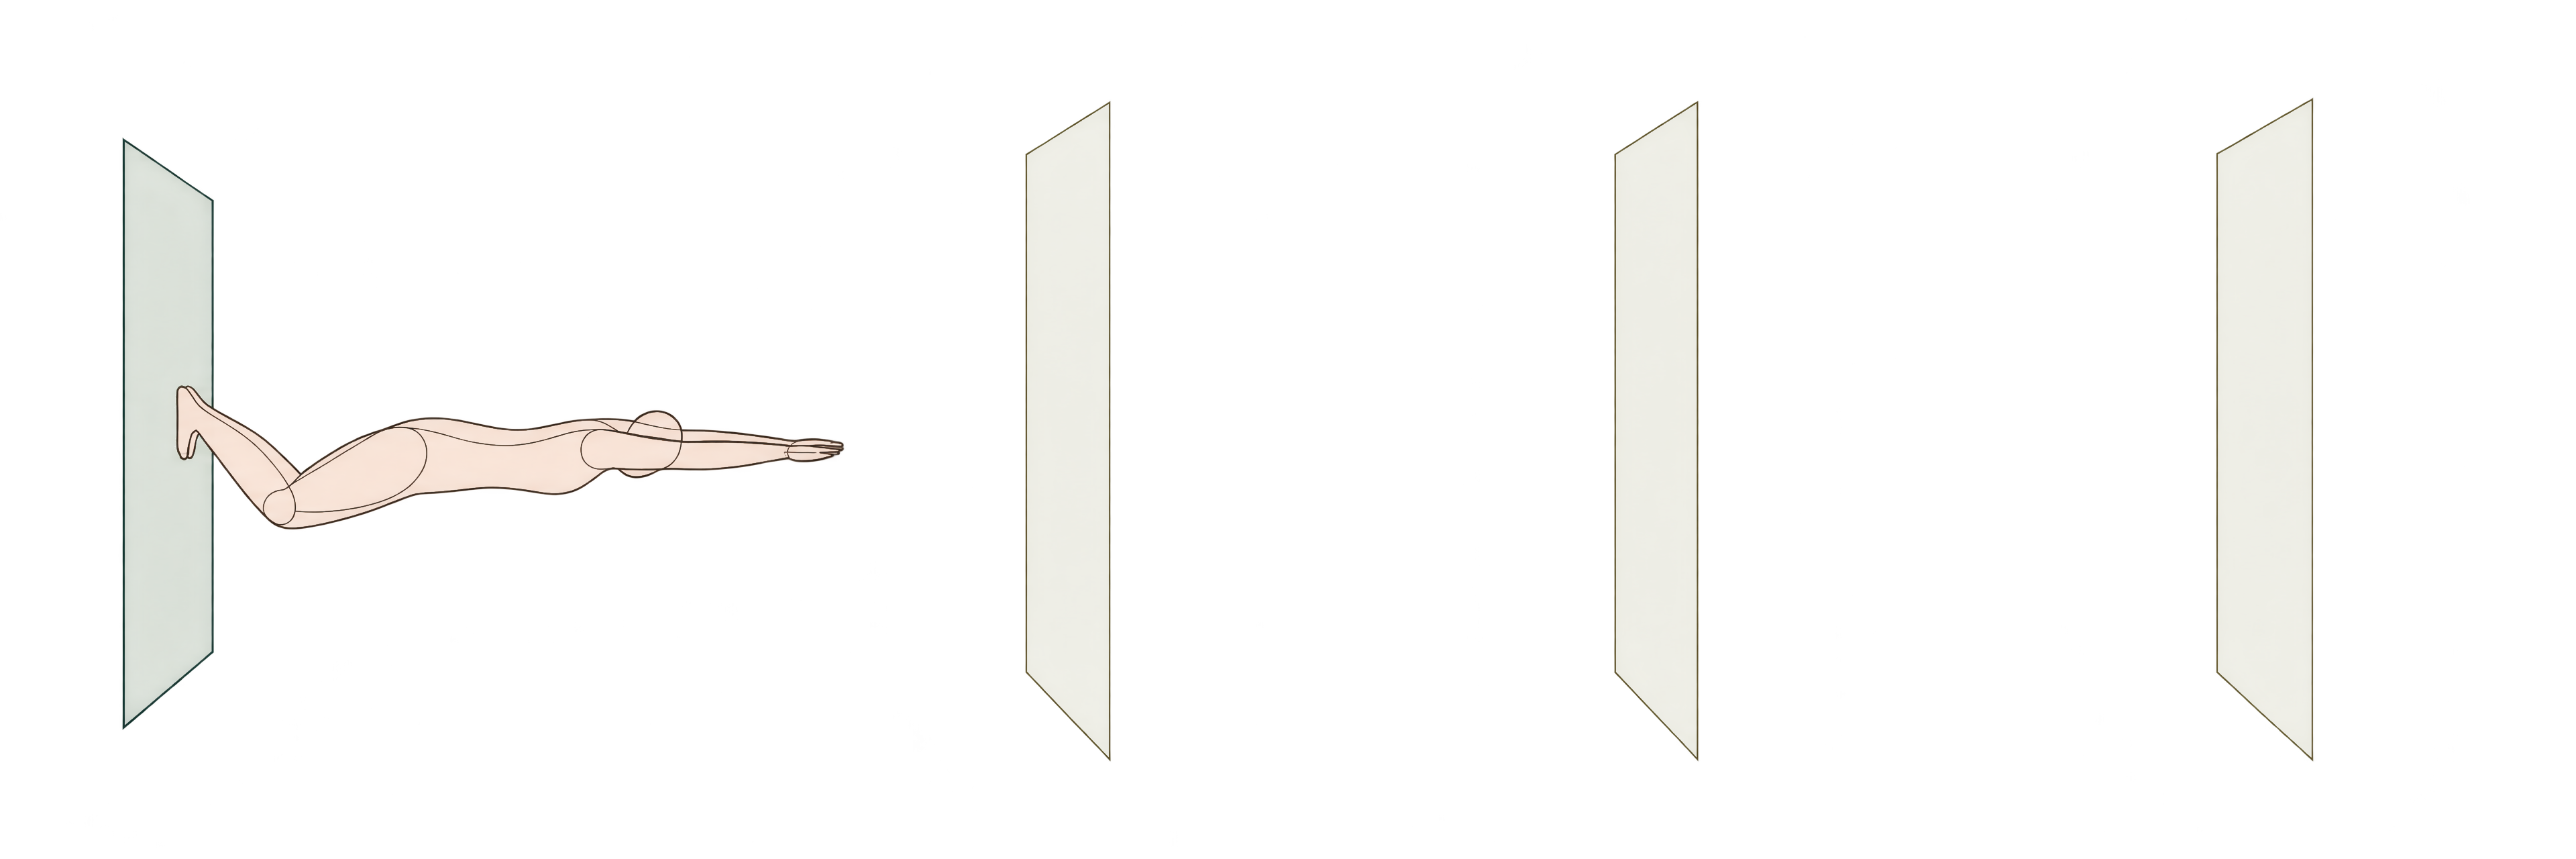
In a 25-yard pool, a 1000 freestyle gives you 39 flip turns. Thirty-nine times in ten minutes you plant both feet on a wall, push off faster than you can swim, hold a streamline under the chop, and come up several body lengths down the pool before you have to breathe. Move the race to a 50-meter pool for the 800 and 24 of those walls are gone: fifteen turns across 800 meters of open water, and in the back half every extra stretch of surface swimming is another stretch of stroke coming apart.
Anyone who has swum the 1000 in winter and the 800 in summer knows in their lungs that the wall changes the race. The rulebooks turn that into arithmetic. The NCAA rules book's sample conversion tables (the 2025–27 edition) multiply your time by one constant per event and category, so a 43-second 100-yard freestyle and a 68-second one get the same multiplier. The other common rule, Colorado Timing, multiplies by a constant and adds a fixed amount per 50 that depends on the stroke.
That second rule is an old friend. About 25 years ago I built a course converter in JavaScript and PHP that implemented it, and the converter traveled further than I ever expected: it's been used and cited widely, and SwimSwam still credits it. The formula itself is documented in the help pages of SportsEngine Motion, the meet and team platform that used to be TeamUnify.
Turnmark started as a rebuild of that converter in something more modern, an offline app with both the Colorado and NCAA rules, because those are the ones on the meet sheet. Then I wanted to know how well they hold up against swimmers who raced both pools within a month, and whether I could build a better rule of my own from those swims. So I collected 8,506,767 races from 6,071 meets across 292,474 swimmer IDs (the same swimmer can carry a different ID in each archive), from public meet archives that reach back as far as 2010. The first model I fitted and shipped answered the wrong question: it converted a 14:13.00 men's 1650 yards to the 1500 meters and back, and the round trip added fifteen seconds.
#What should a conversion preserve?
The obvious way to fit a conversion is to predict it: take every swimmer who raced a yards 100 free and a long-course 100 free within a month, and fit the long-course time from the yards time. That fit is honest about what it estimates, which is what swimmers who posted your time typically swam in the other pool. It's also pulled toward the middle. Any single swim is part ability and part day. The fastest entries include swimmers having unusually good days, so the fit pulls that group toward the middle, and the slowest entries get the opposite treatment.
That's a fine answer to a forecasting question. A seed time isn't a forecast. When a coach converts a summer 1:07 into yards, the question is what that swim is worth in the other pool, the equivalent performance, and an equivalent has to obey rules a forecast doesn't:
- A slower entered time can't convert to a faster one.
- Converting back recovers the time you entered.
- Going from yards to long course through short-course meters lands where going directly does.
That first model was a forecast, a pace curve fitted to the pairs from an earlier, smaller cut of the archive, and it fails the second rule. The 14:13.00 went out to 14:41.46 and came back as 14:27.98, fifteen seconds added on a trip that should have been a loop, because each leg pulled the swim toward the typical swimmer, and the pulls didn't cancel. A women's 100 free went 58.32 out and 58.48 back. Smaller, but it's the same leak. I retired the pace curve.
Clock times add one more wrinkle. Swimming records hundredths, and Turnmark, like NCAA, truncates: anything past the hundredth is dropped, not rounded. Truncate the way out and the way back and a round trip can come back a hundredth or two fast even when the arithmetic underneath is exact. So the rules above hold before the final truncation, and the engine truncates once, at the end. On every hundredth across each event's plausible range, in every direction, 10,119,368 round trips, the shipped model comes back 0.01 seconds fast 96.9 percent of the time and 0.02 fast the rest, never slow. The detour through short-course meters matches the direct conversion exactly half the time and is never more than 0.02 off.
#Three pools, one scale
The model that replaced the curve stops converting pool to pool. For each event and category (women's 100 free, men's 200 fly) it builds three maps, one per pool length, from that pool's times onto one shared scale. A point on the scale stands for one level of performance in that event, and a conversion goes in through the entered pool's map and out through the other pool's map.
The scale needs coordinates, so the yards map is the identity: a point on the scale reads like a yards time. That choice is a convention; any of the three pools could anchor it. About two-thirds of the races in the archive are yards swims and almost all the rest are long course, so yards make the scale easy to read and easy to check.
Take a women's 100 free of 58.32 in yards. On the shared scale it sits at 58.32, because the yards map is the identity. The long-course map takes that point to 67.2633 seconds, and the screen shows 1:07.26. The short-course-meters map takes the same point to 65.78999, which truncates to 1:05.78. Run that unrounded short-course value through its own map and back out to long course and you get 67.2633 again, the same number to every digit the arithmetic carries, because both paths pass through the same point on the scale. Start from the displayed 1:05.78 instead and you get 1:07.25, a hundredth fast, which is the truncation and nothing else. Converting the 1:07.26 back to yards gives 58.317, and the screen shows 58.31.
Each map is a straight line in log time between two knots at the edges of the fitted range: the span of times the training pairs cover, less the fastest and slowest half-percent. A straight line in log time is a power law in seconds, and chaining two of them gives another, so inside the fitted range the conversion has the form y = C·x^b. When b = 1 that's an ordinary multiplier; estimating b lets the ratio change with the entered time.
For this event, yards to long course, b is 0.963. Because the yards map is the identity, b is just the long-course map's slope, and C is about 1.339. So the ratio drifts down as the swim gets slower (figure 2, top): 1.160 at the fast edge of the fitted range (50.17 seconds in yards), 1.153 at 58.32, 1.140 at 80.00. NCAA's ratio is 1.144 at every speed, and it converts the same 58.32 to 1:06.72.
In this event, then, the fitted long-course-to-yards ratio is larger at faster times. The paired swims don't tell me how much of that difference comes from turns, underwater skill, or changes between the two races.
Beyond the fitted range, each map continues with slope 1 in log time, holding its own ratio at the edge value. For this women's 100 free conversion, the long-course map reaches its edge at 50.17 seconds in yards; below that, the ratio stays at 1.160. The warning can come on earlier than that. Each pool's map has its own edges, and when one runs out first the other can still be inside its range, so the ratio keeps drifting until the second one runs out too (figure 2, bottom, short-course meters to long course). So the warning says only that the number is extrapolated.
The six directions, yards to long course and back, yards to short course and back, short course to long course and back, all come from those three maps. Six separate formulas, one per direction, would each stand alone: fit one flat multiplier per direction from the same pairs and each is reasonable, but nothing forces them to agree: on the test swims, a round trip through two separately fitted multipliers came back as much as 0.83 seconds off, and a detour through the third pool as much as 16.84. With shared maps, the inverse and the detour are the same arithmetic.
#How the races fit those maps
The evidence is the same swimmer racing the same event in two pool lengths within 30 days. Prelims and finals collapse to the fastest swim at each meet, and each swim pairs with the nearest-dated swim in the other pool. After screening out implausible pairs, that leaves 134,912 pairs from 31,994 swimmers, each used in both directions.
The obvious fit is a regression line through those pairs, and it walks straight back into the forecasting problem. Ordinary regression treats the entered swim as exact and puts all the noise on the other one. Both swims carry noise: a taper, a morning prelim, a lane next to someone faster, a touch that came up short. When the entered time is noisy, the regression slope flattens, and a flattened slope is the pull toward the middle, built into the line.
The fix needs one more fact: how noisy each pool's swims are on their own. For that I used 803,195 repeat swims by the training swimmers, the same swimmer in the same event and the same pool length at different meets 1 to 30 days apart. Keeping the swimmer, event and pool length fixed gives an estimate of race-to-race variability: mostly race-day noise and a month's change in form. With those noise estimates, the fit is a Deming regression, an errors-in-variables line that splits the scatter between the two axes in proportion to each pool's noise.
Then the cells get thin. Fewer than one race in a hundred in the archive is short-course meters, so there are 6,534 yards-to-short-course pairs in each direction and 7,264 short-course-to-long-course ones, against 121,114 between yards and long course. Each event and category has three course pairs, 84 cells in all, and 30 of them have fewer than 100 effective swimmers, the line I chose for calling a cell thin. Effective swimmers count each swimmer once, however many pairs they contribute. So each cell's line shrinks toward its event's line, pooled across men and women, and each event's line shrinks toward pool geometry and a flat ratio, in proportion to how little evidence the cell has. A last step reconciles the three course-pair lines into one map per pool, which is how the six directions end up sharing parameters.
Every swimmer went into one of three groups, training, validation or test, so no swimmer's races were used both to fit the model and to grade it. The test group is 4,710 swimmers and 39,314 conversions.
#What the extra structure buys
On those test swimmers, the gain column is how much less the shipped model misses than each method on the same swims, with a 95 percent interval from resampling whole swimmers 2,000 times. The last column is the largest round-trip error on any test swim.
| Method | Avg. miss | Gain [95%] | Worst round trip |
|---|---|---|---|
| Colorado Timing | 3.65s | 0.88s [0.81, 0.95] | 0.02s |
| NCAA sample tables | 3.04s | 0.27s [0.24, 0.30] | 0.02s |
| Fitted flat multiplier | 2.86s | 0.087s [0.070, 0.104] | 0.83s |
| Percentile matching | 2.79s | 0.017s, not established* | 2.79s |
| Percentile, with age | 2.79s | 0.015s, not established* | 2.61s |
| Turnmark Equivalence | 2.77s | — | 0.02s |
*After correcting for the number of comparisons.
Against a constant ratio the gain holds up. The model misses by about a quarter-second less than NCAA on average, and by 0.087 seconds less than the fairest single-factor rival, one multiplier per direction fitted to the same pairs, and neither interval comes close to zero.
The top row is the rule my old converter ran for 25 years. It misses by 3.65 seconds on average, the worst of the six. It holds up in the sprints, where it beats NCAA in the 50 free, and comes apart in the distance races. Some of that is the published rule itself: it converts yards to short-course meters with the same 1.11 it uses for a 100, even when a 1650 becomes a 1500, so a 17:36.20 mile converts to a 19:32.38 1500 meters, nearly two minutes slower than NCAA's 17:33.04. Turnmark implements the rule as documented and flags that case. Eight million races are a harder grader than a meet sheet.
On average accuracy, the maps and percentile matching are a tie, and the case for the maps rests elsewhere: on behavior in the thin cells and on a real clock. The worst round trip on any test swim is 0.02 seconds for the maps and 2.79 for percentile matching.
Percentile matching is the row I can't beat. It maps your time's place in one pool's field to the same place in the other, and lands 0.017 seconds behind. That gap clears zero on its own interval, but I ran enough comparisons that it doesn't survive correcting for them, and with the swimmer's age the gap is inside the noise. On this test, matching places in the field is about as accurate as the shared maps. In one direction, long course to yards, the age-aware version beats mine by 0.06 seconds, and grouped by speed its errors show a little less leftover pattern than the maps' do.
Start with the thin cells. From short-course meters to long course, where each pool's field is small, the maps miss by 0.18 seconds less than percentile matching and 0.37 less than its age-aware version, on 1,030 test conversions, and both gaps survive the correction. Then the clock. My percentile maps also pass through a shared scale and invert exactly before rounding, but they have steep stretches, and there the hundredth that truncation drops between conversions gets amplified: a round trip came back as much as 2.79 seconds off on a test swim, and a detour through the third pool 3.43. The shared maps' slopes stay near 1, so the same truncation never moves a round trip more than 0.02. A coach who converts a summer time to yards, then checks it against a winter cut, then converts back, should get the swim they started with.
That last number surprised me more than anything else in the comparison. Both kinds of map pass the invertibility test: run a time out and back at full precision and it returns to within a rounding error. The trouble is the clock. A real conversion displays hundredths, and a coach who converts back starts from the displayed time. Truncation throws away up to a hundredth on the way out, and on the way back that missing hundredth gets multiplied by how steep the return map is at that point.
The shared maps are straight lines in log time with slopes close to 1, so a hundredth lost on the way out is about a hundredth on the way back. A percentile map is built from the quantiles of each pool's field. Where neighboring quantiles in one pool sit almost on top of each other, a cluster of swimmers with nearly identical times, the segment between them is nearly vertical when you go back the other way, and a hundredth dropped there can come back as seconds.
My first guess was that the tables were too coarse. An outside reviewer refit the percentile map with 101, 201, 401 and 1,001 quantile knots: the worst round trip stayed between 1.22 and 2.95 seconds, and removing the truncation made every round trip exact. More knots add more short, steep segments. What fixes it is a map whose slope stays tame across the whole field, and a smooth fit gives you one.
It's a failure that only shows up when a model meets the way people use it. On paper both maps invert. On a pool deck, someone reads 1:07.26 off a screen and types it back in.
The other piece I removed was a correction. Binned by speed, the linear maps leave a small bend in their errors, and a later version added a nonlinear stage tuned to flatten it, which improved the average miss by seven thousandths of a second in that earlier evaluation. Then another reviewer pointed out that the diagnostic I'd tuned against bins conversions by the mean of each pair's own two swims, so it shares their noise, and it trends even for a perfectly correct map when one pool is noisier than the other. I'd been fitting a correction to noise. I took it out. The bend stays, and what it earns is a test on data where the right conversion is known in advance.
#Where I stop trusting the number
The thinnest evidence is short-course meters. The noise of short-course swims could be measured on its own only for the 50 free; every other short-course event borrows a pooled estimate. Yards to short course and back, on 934 test conversions each way, is indistinguishable from NCAA, which uses a fixed published factor there.
The fast end is the other edge. Take an elite men's 1650 yards of 14:13.00. The fitted range for that cell starts at about 14:51 in yards, so this swim is past it, and the model holds the edge ratio: 14:46.57 in the 1500 meters, flagged out of range. NCAA gives 14:43.93. This is where any model fitted to data is on thin ice, and where a rulebook constant is at least honest about being a convention. The mile is also the one event where NCAA and the flat multiplier beat the shared maps on the test swimmers, on 66 conversions from 27 swimmers, which is too few to say much in either direction.
Some error the method can't see at all. The repeat swims measure race-day noise in one pool. They can't measure a swimmer's aptitude for one pool over another, the strong underwater kicker who gains more from 39 walls than the field does. That spread sits in the cross-course pairs and gets counted as something else, so the noise ratio the fit depends on carries an error I can't size.
Two more limits come from the data. Tested on a later season, and on five regional archives held out entirely, the slowest swimmers converted about one percent too fast, most likely because young swimmers improve between their two swims, which a converter that sees one time can't separate from the pool. And these are the public meet archives I could get, weighted heavily toward two of them: Pacific and North Carolina alone supply over half the races. Every pair also comes from someone who raced both pools within a month, which leaves out, say, the kid racing long course for the first time in July. The map describes swimmers who switch pools.
The app marks the conversions it trusts least with one of two warnings. "Outside the model's fitted range" means the entered time maps beyond the range the fit covers, roughly the fastest and slowest half-percent of the pairs, so the number extrapolates. Times out there are sparse, and some swimmers were that fast. "Limited data" means either few swimmers in that event and pool pair, fewer than 100 effective swimmers, or a time where the bootstrap interval for the conversion is wider than one percent. Both cutoffs, like the half-percent edges, are lines I chose; the data didn't fit them. Together the two warnings are my answer to the question underneath this whole project: how one number to the hundredth can admit that the evidence behind it is thin without pretending to be a range. On the test swims, 95.0 percent of conversions carry neither warning, 3.6 percent say limited data, and 1.4 percent say out of range.
#Where eight million races live
The model ships at 14 KB. Getting there took several gigabytes of warehouse, and a decision I went back and forth on.
The data has to answer two opposite kinds of question. Most questions about one swimmer are lookups: this swimmer's last 50 races, newest first. Most questions the model needs are scans: pair every swim with the same swimmer's swims in the other pools within a month, across 8.5 million races, grouped by event and direction. A row store with the right index makes the first fast and the second slow, and columnar files do the opposite.
You could reasonably say a lakehouse for 8.5 million rows is overkill, and on size alone you'd be right. Postgres holds this on a laptop: two composite indexes and an afternoon, one system, transactions, and a query planner that handles both kinds of question well enough. If I were serving live updates from many writers, that's what I'd use.
What tipped it for me was the shape of the data. A swim meet is write-once history. Once it ends its results don't change, except when a correction arrives, and a correction should land as a new version that keeps the old one. The research wants the whole archive frozen at a point in time; the app wants one swimmer at a time. That shape buys three things I'd otherwise build by hand:
- Pinned snapshots make the research reproducible. Every number in this essay comes from one committed Iceberg snapshot, and the evaluation receipt records which one. DuckDB reads through that snapshot's metadata, so it sees exactly the files that snapshot committed, and a test commits a newer snapshot to prove the pinned research view doesn't move. The build checks what it reads back against what it wrote and writes its manifest last, so a build that fails partway never looks finished.
- One source of truth, everything else rebuildable. The original meet exports stay cached for reparsing, the Parquet files hold the history, and the SQLite copy is a projection I can throw away and rebuild from a snapshot.
- Storage and compute come apart. The Parquet files, compressed with Zstandard and partitioned by year and course, take 367 MB for the whole archive, about 43 bytes a race, and cost nothing while idle. DuckDB reads them today; any engine that speaks Iceberg can read them later, with no database server to keep running.
The fourth thing, corrections as versions, is in the design but not built: today the importer writes one bounded snapshot at a time, and no correction workflow is wired up. The split also has costs Postgres wouldn't. There are two stores that can drift apart, so a probe checks that they agree. And the SQLite projection takes 6.9 GB, about 813 bytes a race, to answer a single swimmer's history in a fraction of a millisecond, while training never touches it. For this project it has been a lookup experiment.
Swimmer registration IDs are replaced at collection with a keyed hash, and the key, the raw exports and the warehouse stay on local storage. What reaches the repository is aggregate receipts and the 14 KB snapshot.
None of that machinery ships. The warehouse is where I find out whether the model is right; what leaves it is a two-knot line per pool for each event and category. The design is in the lakehouse notes, and the next question I ask of these races starts from data I can name.
#The model on deck
A model in a Python notebook doesn't help someone checking a time on a pool deck with no signal. So Turnmark has one rule I don't bend: the math lives in one place. turnmark-core is a small Rust engine that's stateless, deterministic and offline. It takes a swim and a destination and returns a time, with no network call and no server behind it, and it's the only copy of the arithmetic the apps run.
The equivalence model ships inside it as data: three two-knot maps for each of 28 events and categories, 14 KB of JSON compiled into the engine. The heart of the conversion is four lines:
let from = empirical_knots(&event_key, event.course)?;
let target = empirical_knots(&event_key, to)?;
let latent = knot_map(&from, seconds.ln(), true);
let equivalent = knot_map(&target, latent, false).exp();
In through the entered pool's map, onto the shared scale, out through the other pool's. NCAA and Colorado sit beside it in the same engine, read from the same pinned rule tables.
Every client is a thin shell around that engine:
- Web. The engine compiles to WebAssembly, published as
@turnmark/sdk. It runs the web app, an embeddable widget and the card in Turnmark's MCP server, and every change is checked against 8,701 cases that must return the same hundredth in native Rust, in Wasm under Node and in Wasm in Chromium. - iOS and Android. UniFFI generates Swift and Kotlin bindings from the Rust types, so the SwiftUI and Jetpack Compose apps call the same functions and carry no math of their own.
- Agents. The MCP server exposes conversion as tools, so an assistant asked to convert a seed time runs the engine instead of improvising arithmetic.
There is one more copy of the conversion, in the research code, and its job is to disagree loudly: it checks 1,008 reference conversions against the engine to the hundredth, so the model I evaluate is the model that ships.
Offline-first is the point of all of it. Pool decks have bad signal, meets run on phones, and a conversion that needs a server is one that fails when you need it. A small, pure, local engine gives every client the same answer in airplane mode, with nothing to keep running.
NCAA stays the default. A meet's entry rules name the conversion they accept, and on an entry form that names a rule, that rule's number is the one that counts, however the alternatives score on average. The equivalence model is for the other questions: whether a summer long-course swim is better than a winter yards swim, how far a time sits from a cut in a pool you haven't raced, what a time is worth in a short-course-meters meet you've never swum.
Every number here comes from one pinned snapshot of the data, except the retired curve's round trip and the seven thousandths, which come from earlier versions, and the report has the equations, the receipts and the commands to reproduce them.
If you have a time from one pool and a meet in another, try it on Turnmark with the method set to Turnmark Equivalence. Enter 58.32 in a women's yards 100 free, convert it to long course, then convert the 1:07.26 back. It comes back as 58.31: the swim you entered, less the hundredth that truncation dropped. Or convert any swim and open "How this is calculated": it lays NCAA, Colorado and Turnmark Equivalence side by side for that swim, with the spread between them and the walls you gain or lose.
If you swim, coach or run meets and think I've read the wall wrong, I'd like to hear it: the data, the model, the code or the argument. Send me a note.


